
|
Livecoding avec SuperColider et FoxDotHEY ! Me revoilà pour un post sans Le LiveCoding c’est quoi ? J’ai découvert le LiveCoding aux universités d’hiver du Bib, en février, grâce à un atelier d’initiation à la musique algorythmique où j’ai découvert SuperCollider et FoxDot et un autre de LiveCoding collaboratif. Du coup le principe c’est de coder de la musique voilà tout est dit au revoir fin du post lol non non je déconne j’ai fait deux ateliers, un avec Nina et l’autre Ellie, faudra que je retrouve les noms et liens, bon on attaque ! |
Saut d'R : Data Science with R blog

|
Wordcloud pour illustrer un articleLibrairies library(tidyverse) library(tidytext) library(pdftools) library(proustr) library(stopwords) library("mixr") # Lise Vaudor package library(magick) library(wordcloud2) Récupérer le texte du PDF Avec la fonction pdf_text du package pdf_tools txt <- pdf_text("Article Revue Balisages_Joëlle Le Marec et Eva Sandri_25 octobre 2022.pdf") On obtient ainsi un chr de 17 éléments (correspondants aux 17 pages) Une question se pose, qu’est ce que je garde, pourquoi, comment ? Est ce que j’enlève titre et abstract ? noms d’autrice, biblio ? |
|
La Gazette, mon petit canard : ConcoursConcours de la Gazette de Montpellier Le jeu-concours : racontez-nous, sur le thème “La Gazette, mon petit canard”, une histoire ou anecdote que vous inspire La Gazette : texte (court), poème, chanson, vidéo, rap, histoire drôle, tableau, sculpture… Laissez parler votre créativité. Les créations les plus originales, amusantes, pertinentes, émouvantes, acides, délirantes,… gagneront l’un des 35 lots. Surprenez-nous ! Envoyez votre production (texte, vidéo, photo, etc.) par mail à jb. |

|
Imprimer 4 images en portrait sur un A4Ou Dès fois Ubuntu, c’’est un peu relou… Mais heureusement il y a R L’idée, c’est de mettre 4 images en portrait sur une feuille A4 parce que personne a décidé de coder ça dans le truc d’impression d’Ubuntu 😕. Allez au boulot, on sort les 📦 et c’est parti ! On commence par lire l’image (1.png c’est la sortie Canva jme suis pas foulée), et la mettre dans img. |

|
Come back... in French :PMise à jour Voilà, voilà, depuis le dernier post y a 4 ans il s’est passé beaucoup de choses, je mettrais le “About” à jour parcequ’il est vraiment à revoir 😅 J’ai carrément tout repris à zero, crée un nouveau repo Github. J’ai donc recrée un blog tout vide, puis tenté d’avoir le même aspect que l’ancien… Nous voilà donc 2 jours plus tard 😅 Si tu veux plus de détails tu peux aller voir les 25 commits que j’ai fait pour en arriver là 😅 |

|
Analysis of Umbrella Academy's scripts - Part 1The bible of text mining with R (by Julia Silge and David Robinson) is very, very helpful ! I would like to see the evolution of the characters through the episodes but the scripts that I found no permit to do this because they don’t precise who is speaking 😞. Well, you have the scripts in a data frame, but not very tidy. library(tidyverse) library(tidytext) Words frequency df <- readRDS("df.RDS") %>% mutate(episode_number = str_extract(episodes_titles, "\\d*"), # extract 1 chiffre ou plus episode_title = str_extract(episodes_titles, "(? |
|
|
Scraping Umbrella Academy's scriptsWhy Umbrella Academy ? I’m a big fan of Ellen Page ! I really love her 😍. Juno is one of my favorite movies, no, actually it’s even my favorite movie. Besides, the soundtrack is my ⏰ 🎶. So I had to watch this series, and it is awesome ! (Okay, maybe I’m a little biased). I’ve only seen the first five episodes so far. I’m taking my time because I know I’ll be super sad 😭 when I’m done with the season. |

|
R-Ladies MeetupR-Ladies Montpellier meetups Since december 2018, I co-organise with Criscely the R-Ladies Montpellier meetups. You can follow R-Ladies Montpellier on twitter and github. Here are my slides, made with xaringan and the R-Ladies theme: Meetup 1 : little talk about Tidyverse : Meetup 2 : Let’s code TogetheR - Tidyverse Exercises : You can find the complete code of the slides here. And I’m going to write a post very soon with some useful tips for making xaringan slides, like how to make header and footer, how to insert interactive plots made with plotly or gganimate. |
|
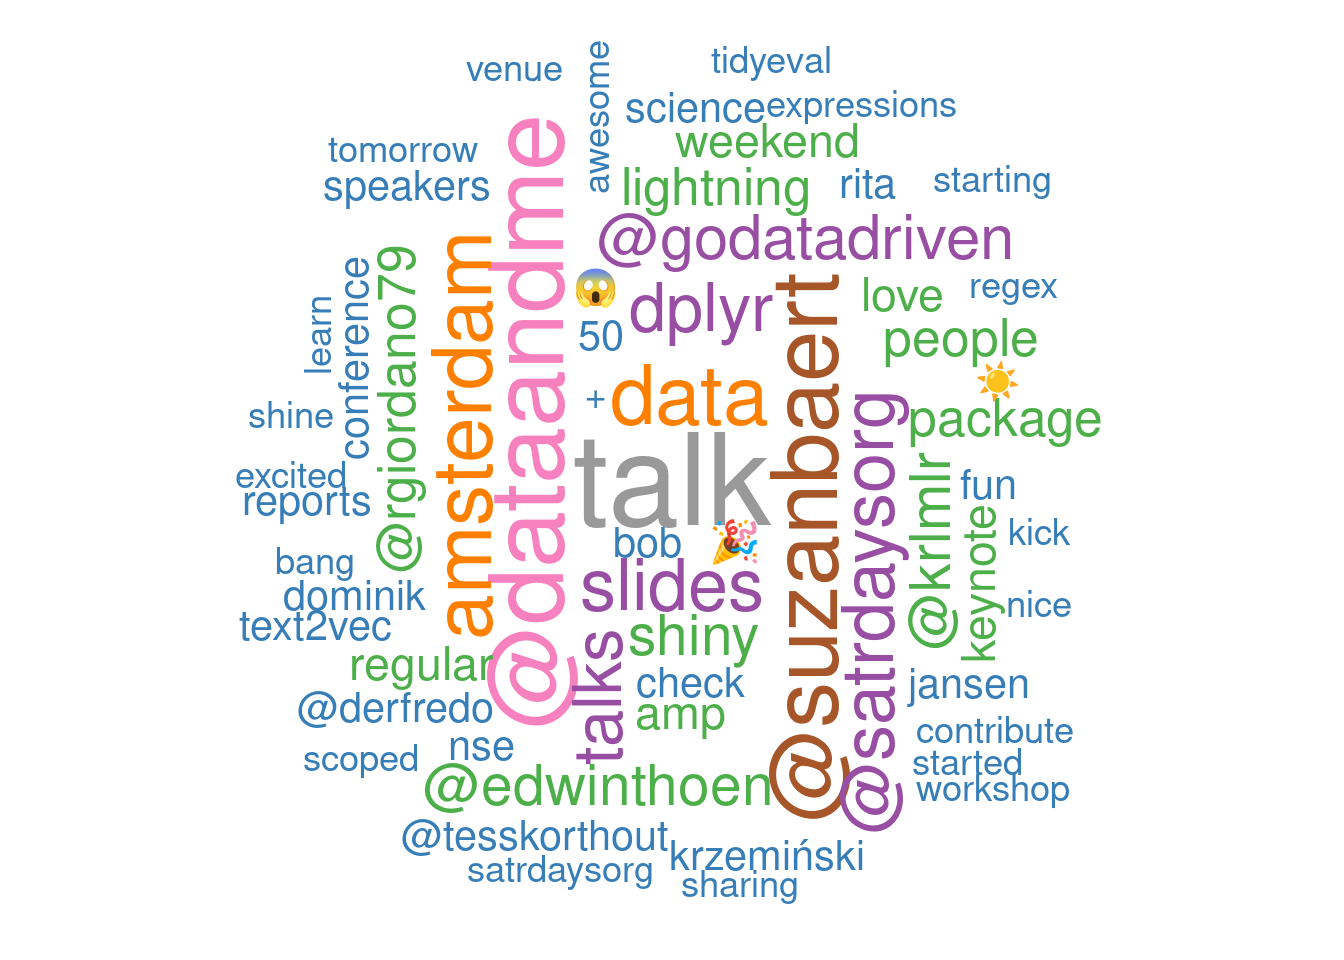
AmstRday's tweetsThese lines of code have been lying around in a file for more than 2 months. I wrote them after SatRdays Amsterdam in September. Packages installation library(tidyverse) library(rtweet) library(knitr) library(kableExtra) library(ggiraph) library(magick) library(tidytext) library(wordcloud) library(widyr) library(igraph) library(ggraph) library(ggmap) library(maps) library(plotly) Scraping the tweets # rt_AmsteRday <- search_tweets( # "#AmsteRday", n = 2, include_rts = FALSE # ) # rt <- rt_AmsteRday # # vect <- c("#AmstRday", "#satRday", "#satRdays", "#satRdayAMS", "#satRdaysAMS") # # for( vec in vect){ # # rt_vec <- search_tweets( # vec, n = 18000, include_rts = FALSE # ) # rt <- bind_rows(rt, rt_vec) # } # # # rt <- rt %>% # unique() # # saveRDS(rt, "conttweets. |
|
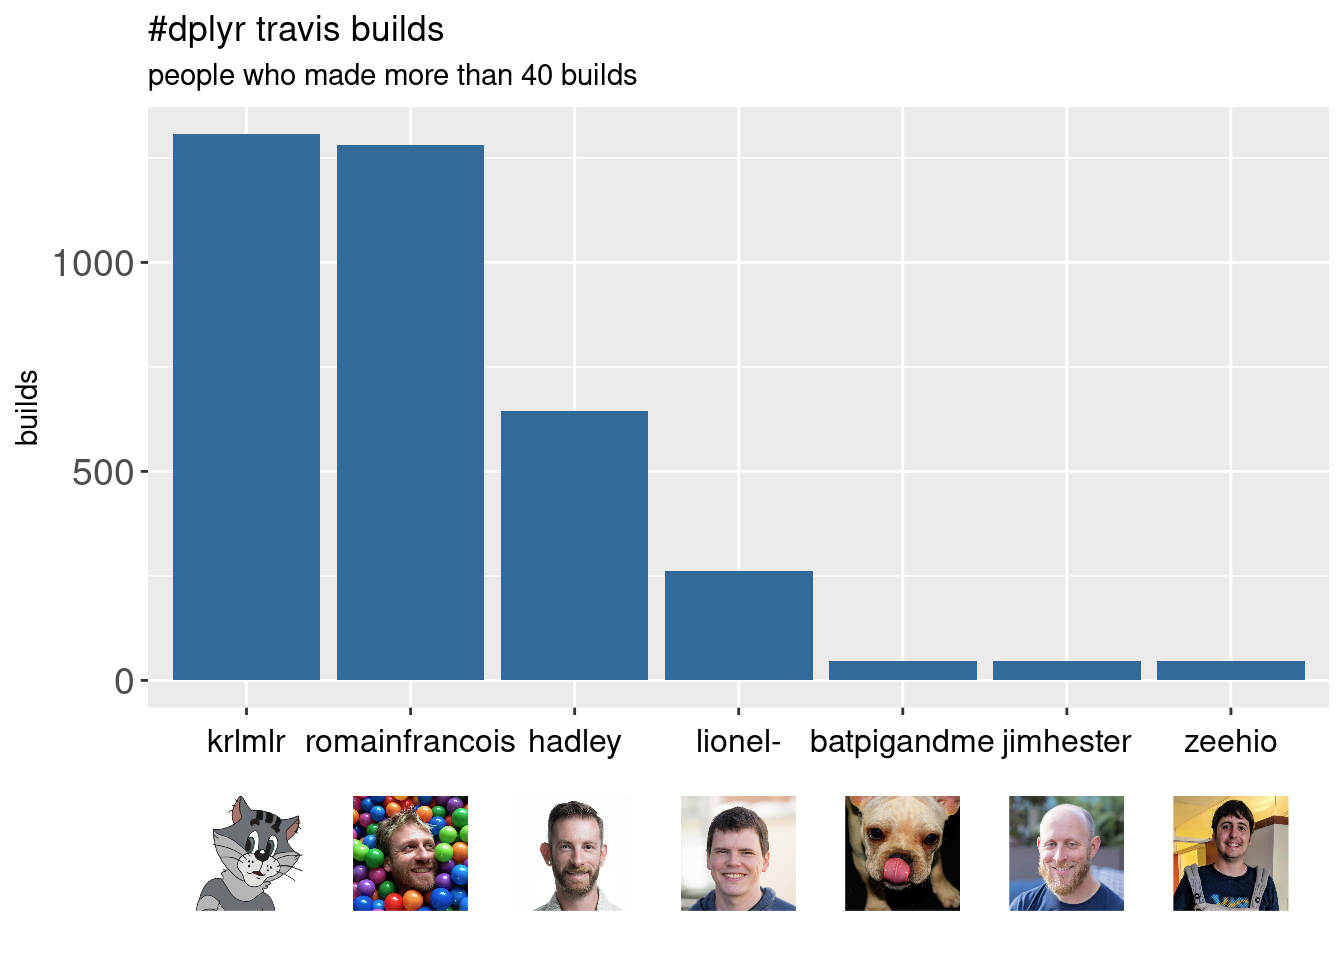
Playing with dplyr5000 - Part 1dplyr5000 is a data package with the 5000 first travis builds of dplyr. I would like to make a beautiful barplot with these data, inspired by this tweet from Mara Averick. 📷 Further adventures in ggplot2 x-axis image labels… "Images as x-axis labels (updated)" ✏️ @carroll_jono "photo alignment with graph in r" (SO answer) @ClausWilkehttps://t.co/p8Tvs4sghn #rstats #dataviz /* ⛹️📊 atrocities mine, obvs */ pic.twitter.com/Wew5Wo9q4f — Mara Averick (@dataandme) October 11, 2018 Packages gh allows to get data from github. |